Going beyond top-line sales reporting and drilling down into your market basket is essential to gain insight into customer purchasing. Unfortunately, getting market basket data can be challenging. It requires complex queries across large data-sets fitting the user's specific geography, product, and time frame requirements.
Today, many companies either can't get market basket information or require a request into a data science group that is prioritizing against their own strategic projects to get it. It’s becoming essential to have a real-time retail analytics solution that can provide advanced market basket metrics - in an easily-understandable format - to everyone in the organization.
Let’s look at how retail analytics can be applied to your market basket.
Reading Your Total Market Baskets
Market basket analysis is all about analyzing the items purchased during a customer's transaction. However, trying to decipher all of these transactions at numerous store locations is difficult when you don't have software to give a comprehensive view.
With better analytic tools, you'll get a full picture of all your market baskets and see what people buy in each store. Using enhanced search features, you can retrieve data from each location and analyze what people bought within a certain time frame.
Real-time capabilities take this even further. You can see which products consumers buy, as well as anything else they bought at the same time.
Market Basket Penetration
There are millions of customers walking by your product sitting on the shelf. To properly sell to them, it's crucial to understand their purchasing behavior through the use of buying data. Without this data, the only information available are generalities, which leads to discrepancies and inevitable revenue loss.
By utilizing the right buying and purchasing data, your company will help increase the amount of customers noticing and purchasing your product. Gaining visibility into this data is crucial, as penetration is a valuable metric.
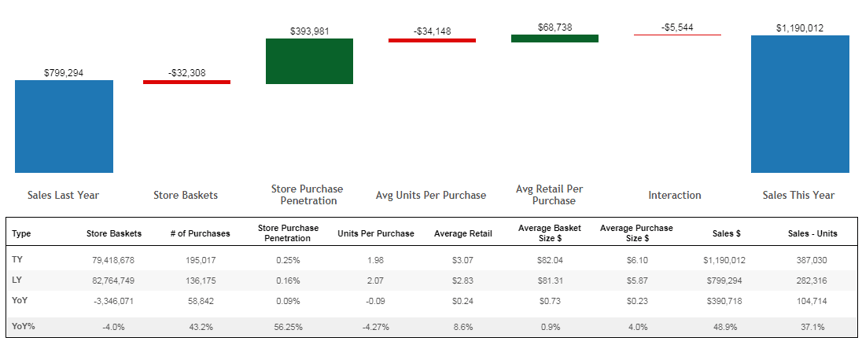
Maintaining or increasing your penetration means that your company is capitalizing on the customers shopping the aisle. For example, if store traffic is growing, your penetration percentage will reveal whether you are reaping the benefits of additional customers coming into the store.
With an analytic tool, you can see all this data in real time and understand how your strategy is impacting the customer's decision on whether to purchase your product. You can get detailed measurements with “units per basket” or “basket size” metrics per store location.
Calculating Average Retail for Each Product
Taking your analytics even further, you can break it down to average retail per product so you know how to price your items. You’ll be able to see whether products truly sell based on their prices, or if other factors are at work.
Since your competitors are probably in a constant pricing war, you need to act accordingly in pricing items based on sales records. Being able to do this with an advanced analytic tool helps save time and money, preventing you from having to find information from more than one source.
Customer-Centric Price Optimization – Bringing It All Together
When thinking about how to price your products, it's also important to know whether the low price you're using is a good price investment. You'll be able to quantify the investment in terms of sales dollars, and quickly understand if spending a large sum of money in a price investment was worth it. How much did you gain from increased penetration or units per purchase? Did it offset the dollars you lost in average retail?

There are many factors that go into determining whether a price investment is successful. Say you sell a product for $2 and sell 1,000 units, totaling $2,000. If you decide to change the price to $1, selling 1,000 units now only equates to $1,000. What you can't see from this example is how the price change impacts the number of customers that purchase your product and the number of units they purchase in each transaction. You'll need to make sure you're getting more shoppers to buy a higher number of units than what you are giving up in the price.
See Everything In Real Time
Using an analytic platform, its important that everything you see when analyzing your market basket is updated in real time. That means that all the information is going to be accurate, timely, and - most importantly - relevant. This helps you understand consumers’ responses to real time market changes in your price, your competitors’ prices, and the effectiveness of promotions you're running.
Is a lower price causing more customers to put your product in their shopping carts? What products are in a customer's basket in winter as opposed to summer? You'll be able to answer these questions immediately and make faster decisions.
See your business from a new viewpoint, where you don't obscure facts just because your old metrics software glossed over the essentials. Contact us today to get the analytic details you need to take your business to the next level.
