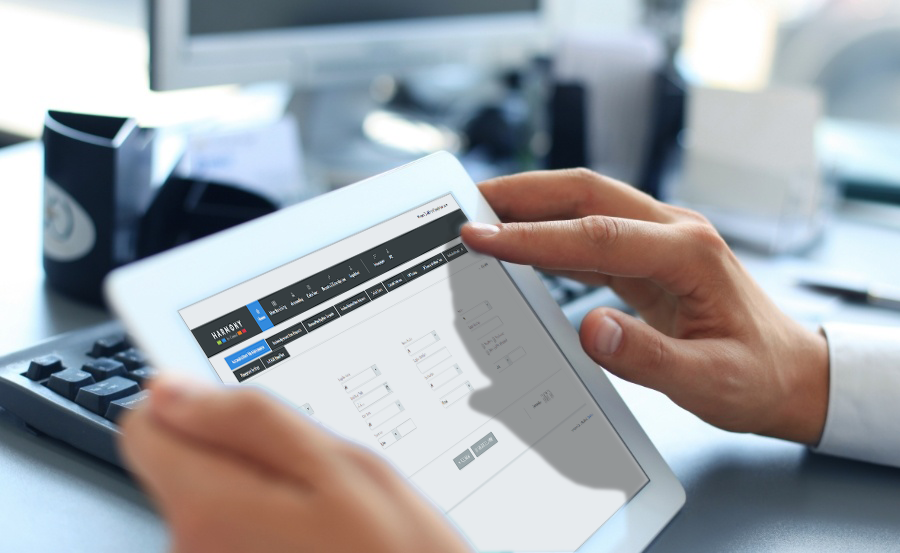
As a retailer, when you log into a retail analytics dashboard, there are basic sales metrics you must check each day. You want to see sales performance for featured products, brands or whole categories. You also want to see which products are out of stock and then assign employees to follow up with suppliers so you can get those in stock as soon as possible. You want to confirm supplier invoicing and payments quickly and easily to identify any billing variances before they become issues. There are so many more ways you can use retail analytics to improve business relationships in your supply chain that you may have never known about.
If you use a data sharing solution, you can give suppliers access to your point-of-sale (POS) data. They can view your current levels of sales based on what actually happens in your brick-and-mortar locations. They will be able to adjust their order and delivery schedules to better meet your needs. Because you want to be connected to the suppliers in your value chain and make better business decisions, we put together these 9 ways you didn't realize you could be utilizing your retail analytics.
1. Analyze which products have dropped in sales month over month.
Using retail analytics, you can generate graphs and charts for every product or category. For example, use a linear graph to see how a product's sales fluctuate over a period of 12 months. Use a stacking bar graph to compare February 2015 sales with February 2016 sales for a product, or even an entire brand of products.
2. Forecast which items will sell out before the end of a feature or promotion.
While a product order may have already been placed with a supplier, you might need to place an emergency order during the promotion to keep from running out. Inventory analytics can help you know how much to order to keep your shelves full.
3. Identify products that might sell more with a lower price point and how much you can increase prices without losing customers.
Using price and promotional evaluation tools, you can predict the increased sales velocity due to sales prices or other price reductions, which provides the ability to generate ROI. Those same tools can evaluate the effect of increasing price points, which allows for increased profits without decreased sales.
4. Identify products selling in other stores that could provide incremental sales.
You can utilize a distribution gap report to audit current products available by store location, and compare to top selling products by category to identify opportunities to add new products that can build overall category volume. This same report can be used to monitor shelf integrity and unauthorized products being delivered to your store locations.
5. Identify poor sellers to optimize your inventory.
These items may satisfy loyal customers, but in stores with small set sizes and limited merchandising real estate, it is important to maximize every square inch of shelf space. Category product ranking reports can help identify opportunities to optimize selection by replacing slow movers with better performing products.
6. Identify service level issues with Direct Store Delivery suppliers to ensure each of your store locations is properly maintained.
If you have store locations that are consistently out of stock, you may be impacted by poor supplier ordering practices, insufficient order and delivery frequency, or your store may be at the end of a delivery route. Use retail analytics to identify issues by supplier, and even by route or driver to make the necessary changes and maintain accountability on an ongoing basis.
7. Understand how your customers shop, what products they purchase together, and how to sell even more.
Gaining visibility to what is in your customers' shopping basket can provide significant insight into how they shop in your store, and what products they buy. Market basket and purchase affinity reports help to correlate products sales and establish trends that can be utilized to tailor promotions, displays and even marketing campaigns.
8. Evaluate promotions offered by suppliers, and adjust your promotional plans accordingly.
Once a promotion begins, the analytics dashboard offers instant feedback on sales. You can evaluate the effectiveness of a promotion the day after the event ends, without having to wait weeks for supplier or market data. This allows you to more quickly implement changes to future events using learning from past performance.
9. Analytics your way.
It's great to have a suite of reports and dashboards to help you hit the ground running, but a robust retail analytics solution should also provide you with the ability to customize views, filters, hierarchies, etc. to make the most efficient use of your time working with large amounts of data. You can utilize ad hoc analysis to pull reports based on your individual criteria.
For details on using retail analytics to maximize your profits, please contact us today.
