I have spent almost two decades working with suppliers and retailers to develop, measure, and act on retail analytics and insights. In order to optimize sales and margin, it is important to truly understand sales trends, drivers and opportunities by bringing together holistic insights to not only determine what is happening when and where, but also to understand the who and why as much as possible.

There are many data points that can be used to produce more holistic insights. The most common of these are point-of-sale data, store and warehouse-level inventory, planograms, promotions, price books, forecasts, and loyalty shopper data. These data sets typically live in their own individual silos, with some data from one silo brought into another as needed. I have found that all of the users consuming the data - including sales, category management, supply chain, retail operations and marketing - are impacted by data outside their typical visibility. It only makes sense to bring together all the facts and causal data into one place to develop more holistic analyses.
One example of the benefit of this all-inclusive approach to data is what happens when you integrate sales transactions alongside planogram data to increase shelf optimization. This provides much-needed context for shelf set productivity by allowing you to slice and dice your items, segments, brands and UPC’s by store and even by planogram - allowing you to evaluate key metrics such as sales and units sold per linear foot and in-stock percentages that ensure accurate assessments of shelf set performance.
An advanced analytics platform can combine these data sets seamlessly into both macro and micro space analysis - providing many benefits to both retailers and suppliers to optimize their real estate at shelf...and their sales:
1. Increase your efficiency.
Be more effective with integrated movement data along with space productivity and in-stock levels. You don’t have to spend your time cobbling multiple data sets together - more centralized analysis can afford you more time analyzing and making more informed decisions. With segments and brands to manage, easily identifying segment productivity is a good starting point. Macro space aisle optimization analysis helps to determine segment space allocation within a category.
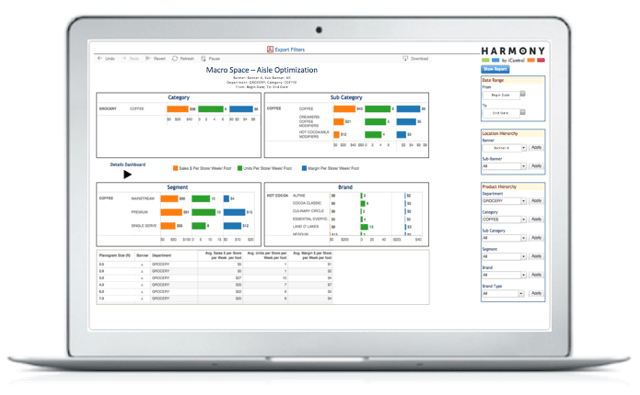 Macro Space - Aisle Optimization [Sample]
2. Dive into the details.
High level category and segment sales performance summaries are valuable, but the ability to drill down within segments to see UPC-level sales $ and units per store per week can help you identify strong and weak performers in each segment, and make adjustments at a micro level that can drive sales and profits.
3. Determine spacing needs.
Identify which items have more space than needed, and which ones do not have enough by utilizing a quadrant analysis to easily visualize top and bottom producers. This micro space segment optimization compares average sales to average shelf space where items in the top left of the quadrant are the most productive items or segments, and those items in the bottom right are the least productive.
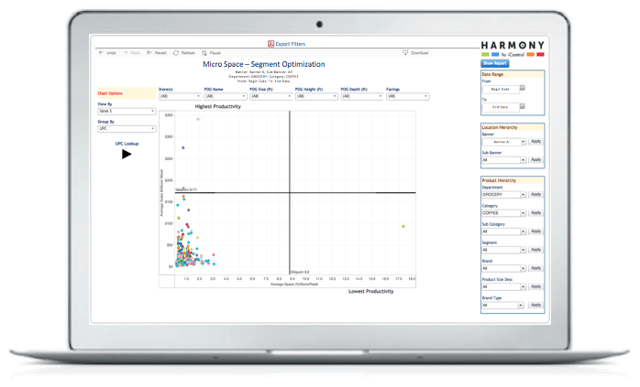 Micro Space - Segment Optimization [Sample]
4. Identify sales opportunities.
Easily identify items you could recommend for a planogram that would produce more sales than an existing UPC, and know the right one to replace it. Easily compare items, brands, segments, and category $ and units per linear foot to determine productivity, and combine with margin to ensure any changes in distribution don't negatively impact profits - which can be a competitive advantage for your company in optimizing valuable shelf space.
5. Identify lost sales.
Determine instances where a product went out-of-stock due to insufficient facings and shelf capacity. Often times, expanding the facings of a high-velocity item and discontinuing a slow mover can add incremental sales to your category. This also maintains high customer satisfaction because you are always in-stock on their favorite items and brands.
6. Determine supplemental inventory needs.
The ability to combine sales projections on high value and high promotion lift items with the capacity per shelf set by store can help identify those stores with insufficient shelf capacity to support base and promotional volume. These stores can then be allocated additional displays and product to support the anticipated increase in item velocity, and minimize out-of-stocks.
7. Gain visibility.
You might not have visibility to items and stores that should be scanning per the planogram set. With this integrated data, an item/store exception list can be generated and acted on to ensure planogram compliance and/or distribution voids are closed. These reports can be used on a regular basis to maintain shelf integrity across all stores and categories, and to monitor distribution of new items into shelf sets by store.
Imagine if you tried to use an online map that was missing large pieces of geography? How would you find your way to your destination if you are missing closed roads, major road construction, new roads, etc? Not to mention getting there quickly if that is important to you. This analogy to me describes looking at data in pieces and parts and never seeing the whole picture. If you have ever heard the phrase “you don’t know what you don’t know”, it really applies in retail analytics.
With most data served up in silos separately from other related data, you don’t always understand much of the cause and effect. By knocking down data silos to include movement and inventory data with planograms you can solve for many issues that can otherwise take months to discover. I will never forget showing my first heat map on space-to-sales analysis showing planograms without enough capacity to support weekend sales, and what lost sales were.
Unfortunately, integrated holistic insights are the exception not the rule today. With a partner like iControl we can make this a reality for you, and bring together the what, where, when with the who and why. Contact me to find out more at Lisa.Bohn@icontroldata.net.
Stay tuned for additional posts in this series on why holistic insights matter, let’s break down those data and business process silos!


/home_riteaid.png)
/home_applebees.png)


/home_safeway.png)


 Micro Space - Segment Optimization [Sample]